Silent Burnout: The Visual Diagnostic & Action Plan
- David Ruttenberg
- Feb 11
- 5 min read

You know that feeling when your brain is running on dial-up in a 5G world? When "just one more task" feels like climbing Everest? When you're checking all the boxes but can't shake the fog?
That's not weakness. That's silent burnout, and it's showing up in record numbers across neurodivergent communities, high-demand workplaces, and caregiving households. 🟡 This isn’t laziness. It isn’t a character flaw. It’s a bio-cognitive slowdown that shows up in predictable patterns: anxiety, fatigue, tunnel vision, missed details.
The good news? Silent burnout has a signature. And once you can see it, you can act on it.
Why Visual Diagnostics Matter
Traditional burnout screeners rely on self-report questionnaires buried in clinical jargon. They're designed for retrospective analysis, not real-time decision-making. But silent burnout doesn't wait for your annual check-in. It compounds daily, missed detail by missed detail, skipped break by skipped break.
That's why I built two companion infographics that do something different: they let you self-score in under 60 seconds and walk away with a clear action step. No gatekeeping. No medicalization. Just honest signal detection.
These aren't diagnostic tools. They're conversation-starters, visual anchors designed to help you name what you're experiencing and decide what comes next.

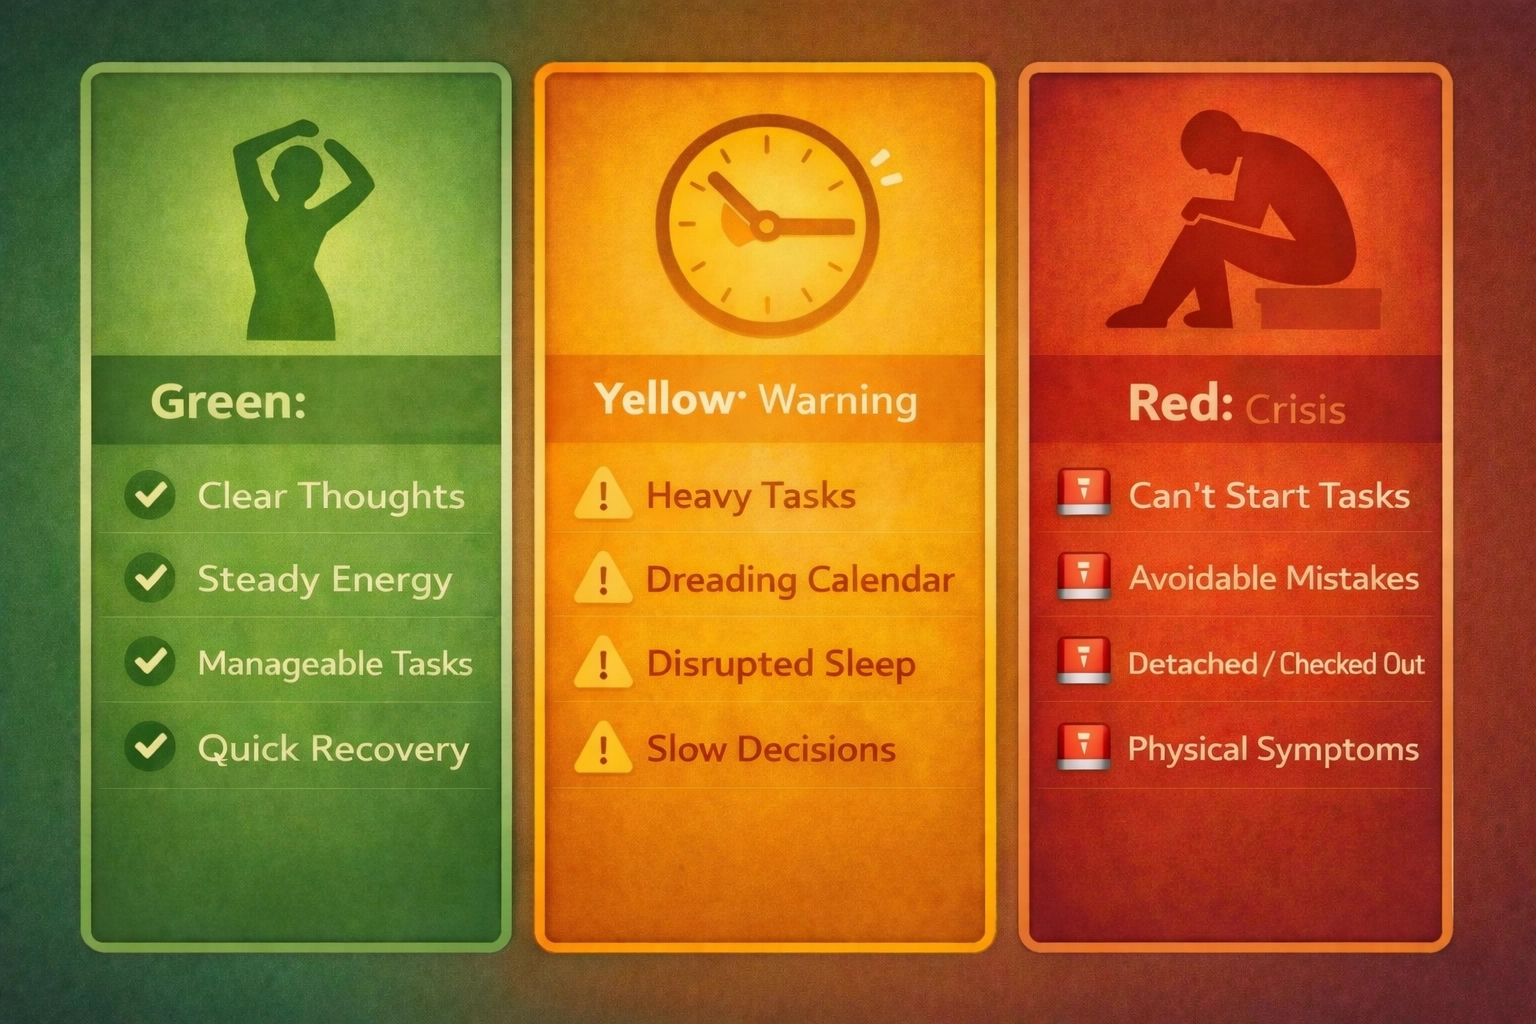
Infographic 1: The Three-Zone Diagnostic
Silent burnout operates on a continuum. The first infographic maps that continuum across three color-coded zones: 🟢 Green (Baseline), 🟡 Yellow (Risk Signals), and 🔴 Red (High-Risk Signals). Each zone includes observable indicators and a simple scoring guide.
🟢 Green Zone: Baseline Indicators
This is your cognitive steady-state, the zone where most people function most of the time. You're managing tasks, recovering between demands, and maintaining social connection. You might feel tired at the end of a long week, but it resolves with rest.
Baseline indicators include:
Keeping up with routine tasks without significant effort
Recovering energy after time off or weekends
Maintaining interest in hobbies and social activities
Sleeping reasonably well most nights
Managing minor stressors without cascading anxiety
If you’re checking most of these boxes most of the time, you’re in the green. Stay here.
🟡 Yellow Zone: Risk Signals (Anxiety/Fatigue Focus)
Yellow signals mean your bio-cognitive system is running hot. You're still functional, but the margins are shrinking. Fatigue doesn't resolve on weekends. Anxiety shows up in places it didn't before. You're forgetting details, missing deadlines, or withdrawing from people you care about.
Risk signals include:
Persistent fatigue that doesn't improve with sleep
Low-grade anxiety that spikes unpredictably
Difficulty focusing or holding attention on routine tasks
Irritability or emotional flatness
Skipping meals, exercise, or self-care routines
Withdrawing from social plans without a clear reason
Scoring (conversation-starter, not a diagnosis): Look back over the last 2 weeks. If you check 3+, treat it as a yellow flag: pause, talk, adjust the load.
🔴 Red Zone: High-Risk Signals
Red signals indicate structural breakdown. This isn't about needing more self-care, it's about needing system-level intervention. Chronic exhaustion. Cynicism. Physical symptoms like headaches, GI distress, or immune suppression. Tasks that used to be automatic now feel impossible.
High-risk signals include:
Chronic exhaustion that persists despite rest
Feeling detached, numb, or cynical about work or relationships
Physical symptoms (headaches, muscle pain, digestive issues)
Difficulty making even simple decisions
Frequent absenteeism or avoidance behavior
Loss of interest in activities that once brought joy
Scoring (conversation-starter, not a diagnosis): If you check 2+, treat it as a red flag. This usually calls for structural intervention (work design, workload, support), not just “self-care.”
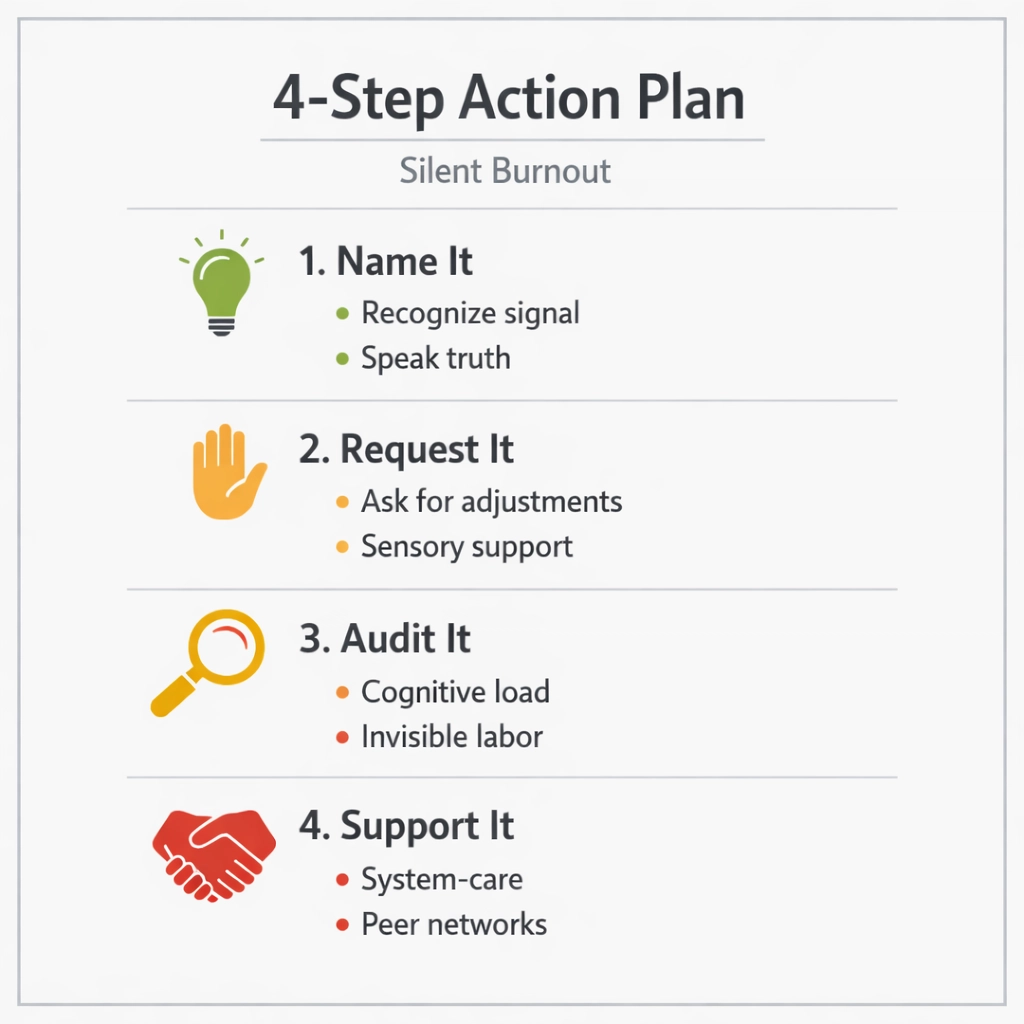
Infographic 2: The 4-Step Action Plan
Spotting the signals is step one. Acting on them is step two. The second infographic outlines a four-part framework that moves from recognition to structural change. Each step builds on the one before it.
1. Name It
Acknowledge the signals without judgment. Say it out loud: "I'm in the yellow zone," or "I'm checking red-flag boxes." Naming breaks the silence and creates space for action. Share it with a trusted colleague, friend, or family member. Write it down. Make it real.
2. Request It
Ask for what you need. That might mean flexible hours, a reduced meeting load, sensory accommodations (lighting, noise), or a temporary workload adjustment. Use language like: "I'm noticing signs of overload and need to adjust my schedule this week to prevent burnout."
3. Audit It
Map your cognitive and sensory load across a typical week. When do you feel most drained? What tasks consume disproportionate energy? Are there sensory stressors (fluorescent lights, open-plan noise, back-to-back Zoom calls) that spike anxiety or fatigue? Identify patterns. Share the audit with your manager or support team.
4. Support It
Seek structural and community support. That could mean adjusting job design, accessing employee assistance programs, connecting with neurodiversity-affirming coaching, or joining peer support networks. 🟡 Fix the system, support the person. Both matter.
Why This Approach Works
These infographics operationalize something most burnout frameworks skip: early intervention through pattern recognition. They don't pathologize stress. They don't medicalize normal fatigue. They give you a language for what's happening and a roadmap for what comes next.
They also center a critical principle: burnout is not an individual failing. It's a system failure. When people burn out, it's usually because the workload, pace, or environment exceeded their bio-cognitive capacity, not because they lacked resilience or grit.
That's why the action plan emphasizes structural change (workload audits, accommodations, job redesign) alongside personal support. You can't self-care your way out of a toxic system. But you can name the problem, request the changes, and build the support networks that make thriving possible.
How to Use These Tools
For Individuals:
Print or save the diagnostic infographic. Check in weekly.
Share your zone with a trusted person. Make it a regular conversation.
Use the action plan as a guide, not a rigid script. Adapt it to your context.
For Managers & HR Teams:
Integrate the diagnostic into team check-ins or 1-on-1s.
Train leaders to recognize yellow and red signals in others.
Use the action plan to guide accommodation conversations.
For Clinicians & Coaches:
Use the infographics as psychoeducation tools.
Pair them with more in-depth assessments where needed.
Center the "fix the system" principle in treatment planning.
Let's Talk
If you're in the yellow or red zone, or if you're seeing those signals in your team, you don't have to figure this out alone. I work with organizations, clinical teams, and individuals to build bio-cognitive safety into daily operations. We can audit your sensory and cognitive load, design accommodations that actually work, and create early-warning systems that prevent burnout before it compounds.
Reach out by email atdavidruttenberg@gmail.comor call my assistant Rachel at +1 (561) 979-0496 to start the conversation.
Because burnout isn't inevitable. It's preventable. And it starts with seeing the signals, and acting on them.
About the Author
Dr David Ruttenberg PhD, FRSA, FIoHE, AFHEA, HSRF is a neuroscientist, autism advocate, Fulbright Specialist Awardee, and Senior Research Fellow dedicated to advancing ethical artificial intelligence, neurodiversity accommodation, and transparent science communication. With a background spanning music production to cutting-edge wearable technology, Dr Ruttenberg combines science and compassion to empower individuals and communities to thrive. Inspired daily by their brilliant autistic daughter and family, Dr Ruttenberg strives to break barriers and foster a more inclusive, understanding world.
References
Maslach, C., & Leiter, M. P. (2016). Understanding the burnout experience: Recent research and its implications for psychiatry. World Psychiatry, 15(2), 103–111. https://doi.org/10.1002/wps.20311
Ruttenberg, D. (2025). Mitigating sensory sensitivity in autistic adults through multi-sensory wearable technology [Doctoral dissertation, University College London]. UCL Discovery. https://discovery.ucl.ac.uk/id/eprint/10210135/
Salvagioni, D. A. J., Melanda, F. N., Mesas, A. E., Gonzalez, A. D., Gabani, F. L., & Andrade, S. M. (2017). Physical, psychological and occupational consequences of job burnout: A systematic review of prospective studies. PLOS ONE, 12(10), e0185781. https://doi.org/10.1371/journal.pone.0185781
Shanafelt, T. D., & Noseworthy, J. H. (2017). Executive leadership and physician well-being: Nine organizational strategies to promote engagement and reduce burnout. Mayo Clinic Proceedings, 92(1), 129-146. https://doi.org/10.1016/j.mayocp.2016.10.004
World Health Organization. (2019). Burn-out an "occupational phenomenon": International Classification of Diseases. https://www.who.int/news/item/28-05-2019-burn-out-an-occupational-phenomenon-international-classification-of-diseases


Comments